Active · Aug 3, 2026
11345 Doña Lola Dr
$1,999,000
4 bd · 3 ba · 2,796 sqft
1 DOM · $715/sqft · Built 1964 · Pool
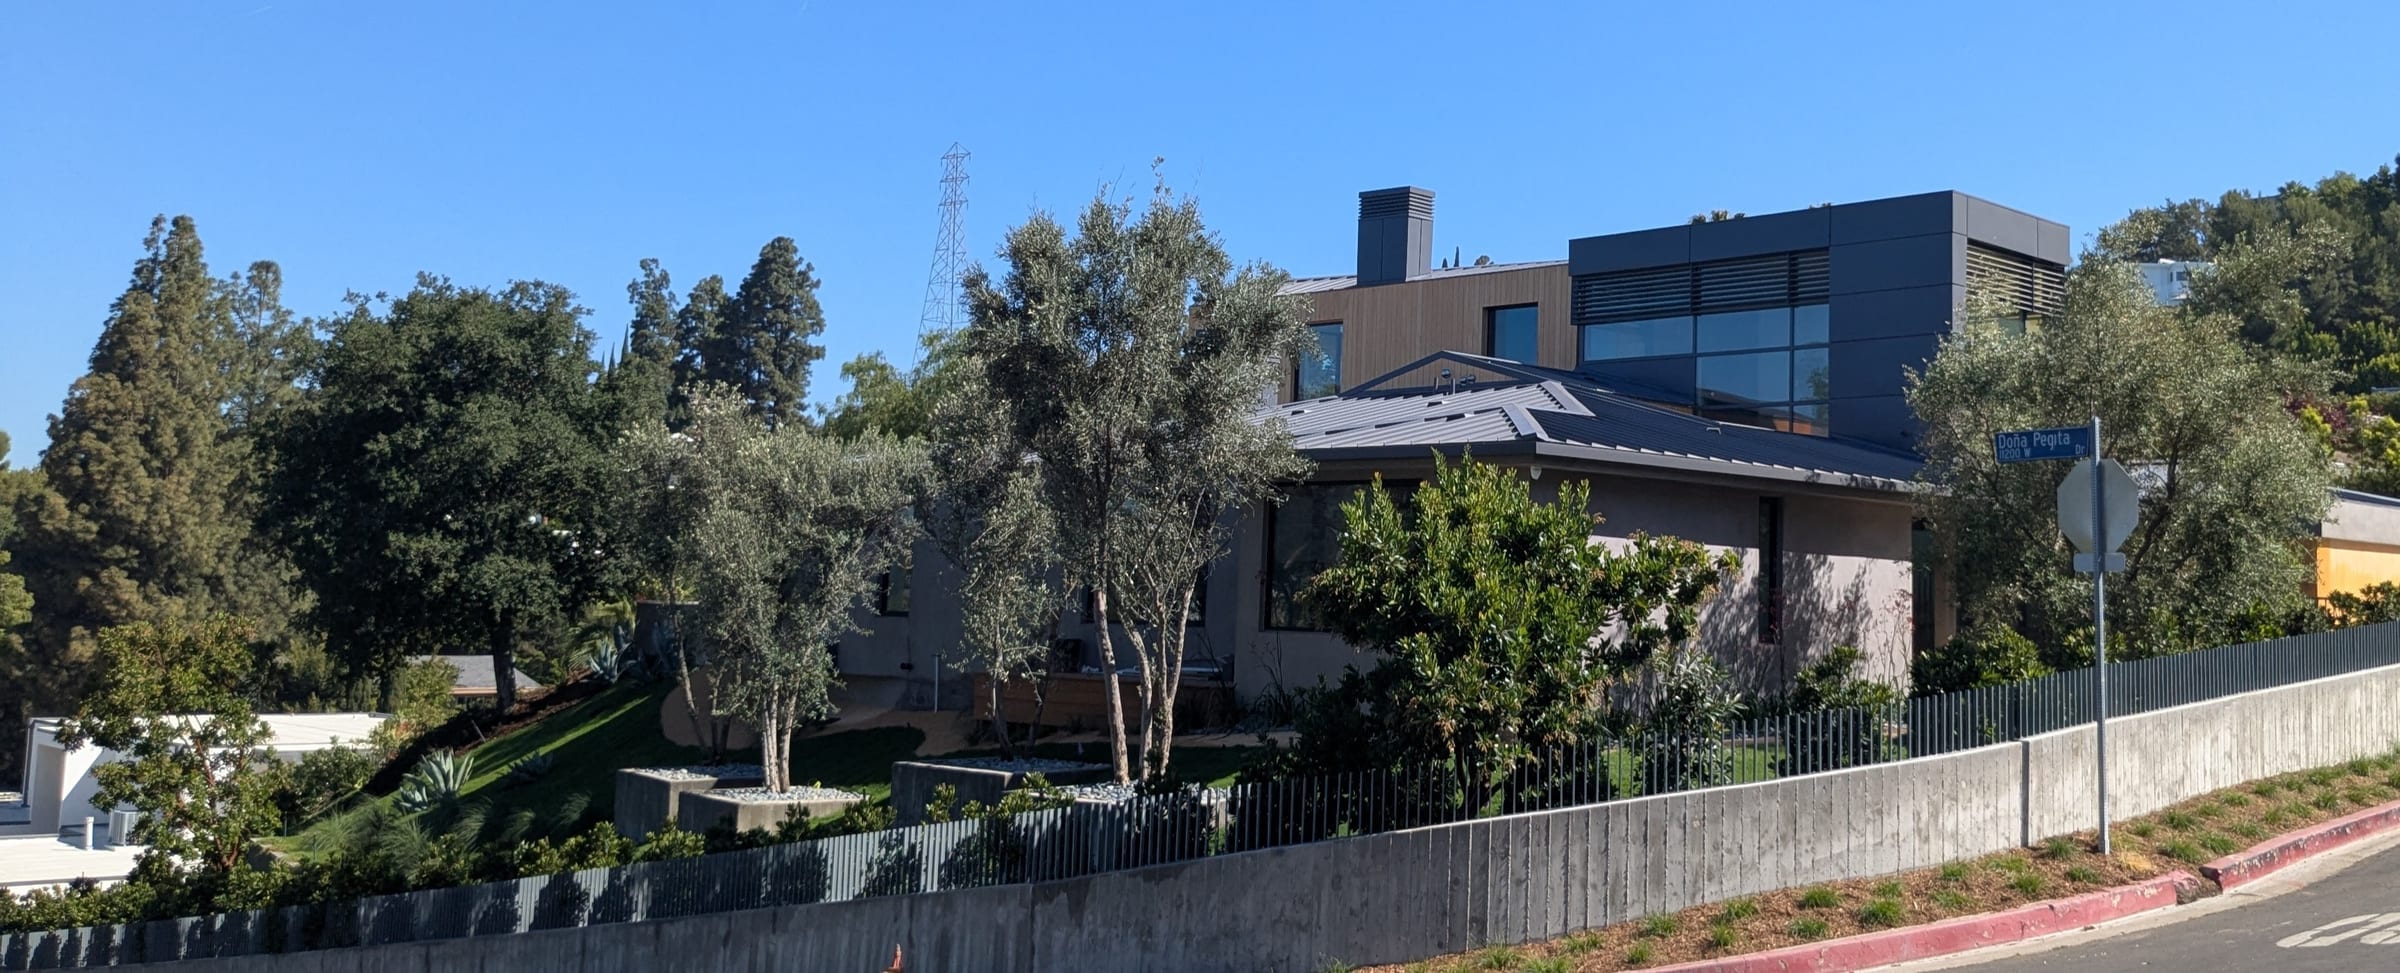
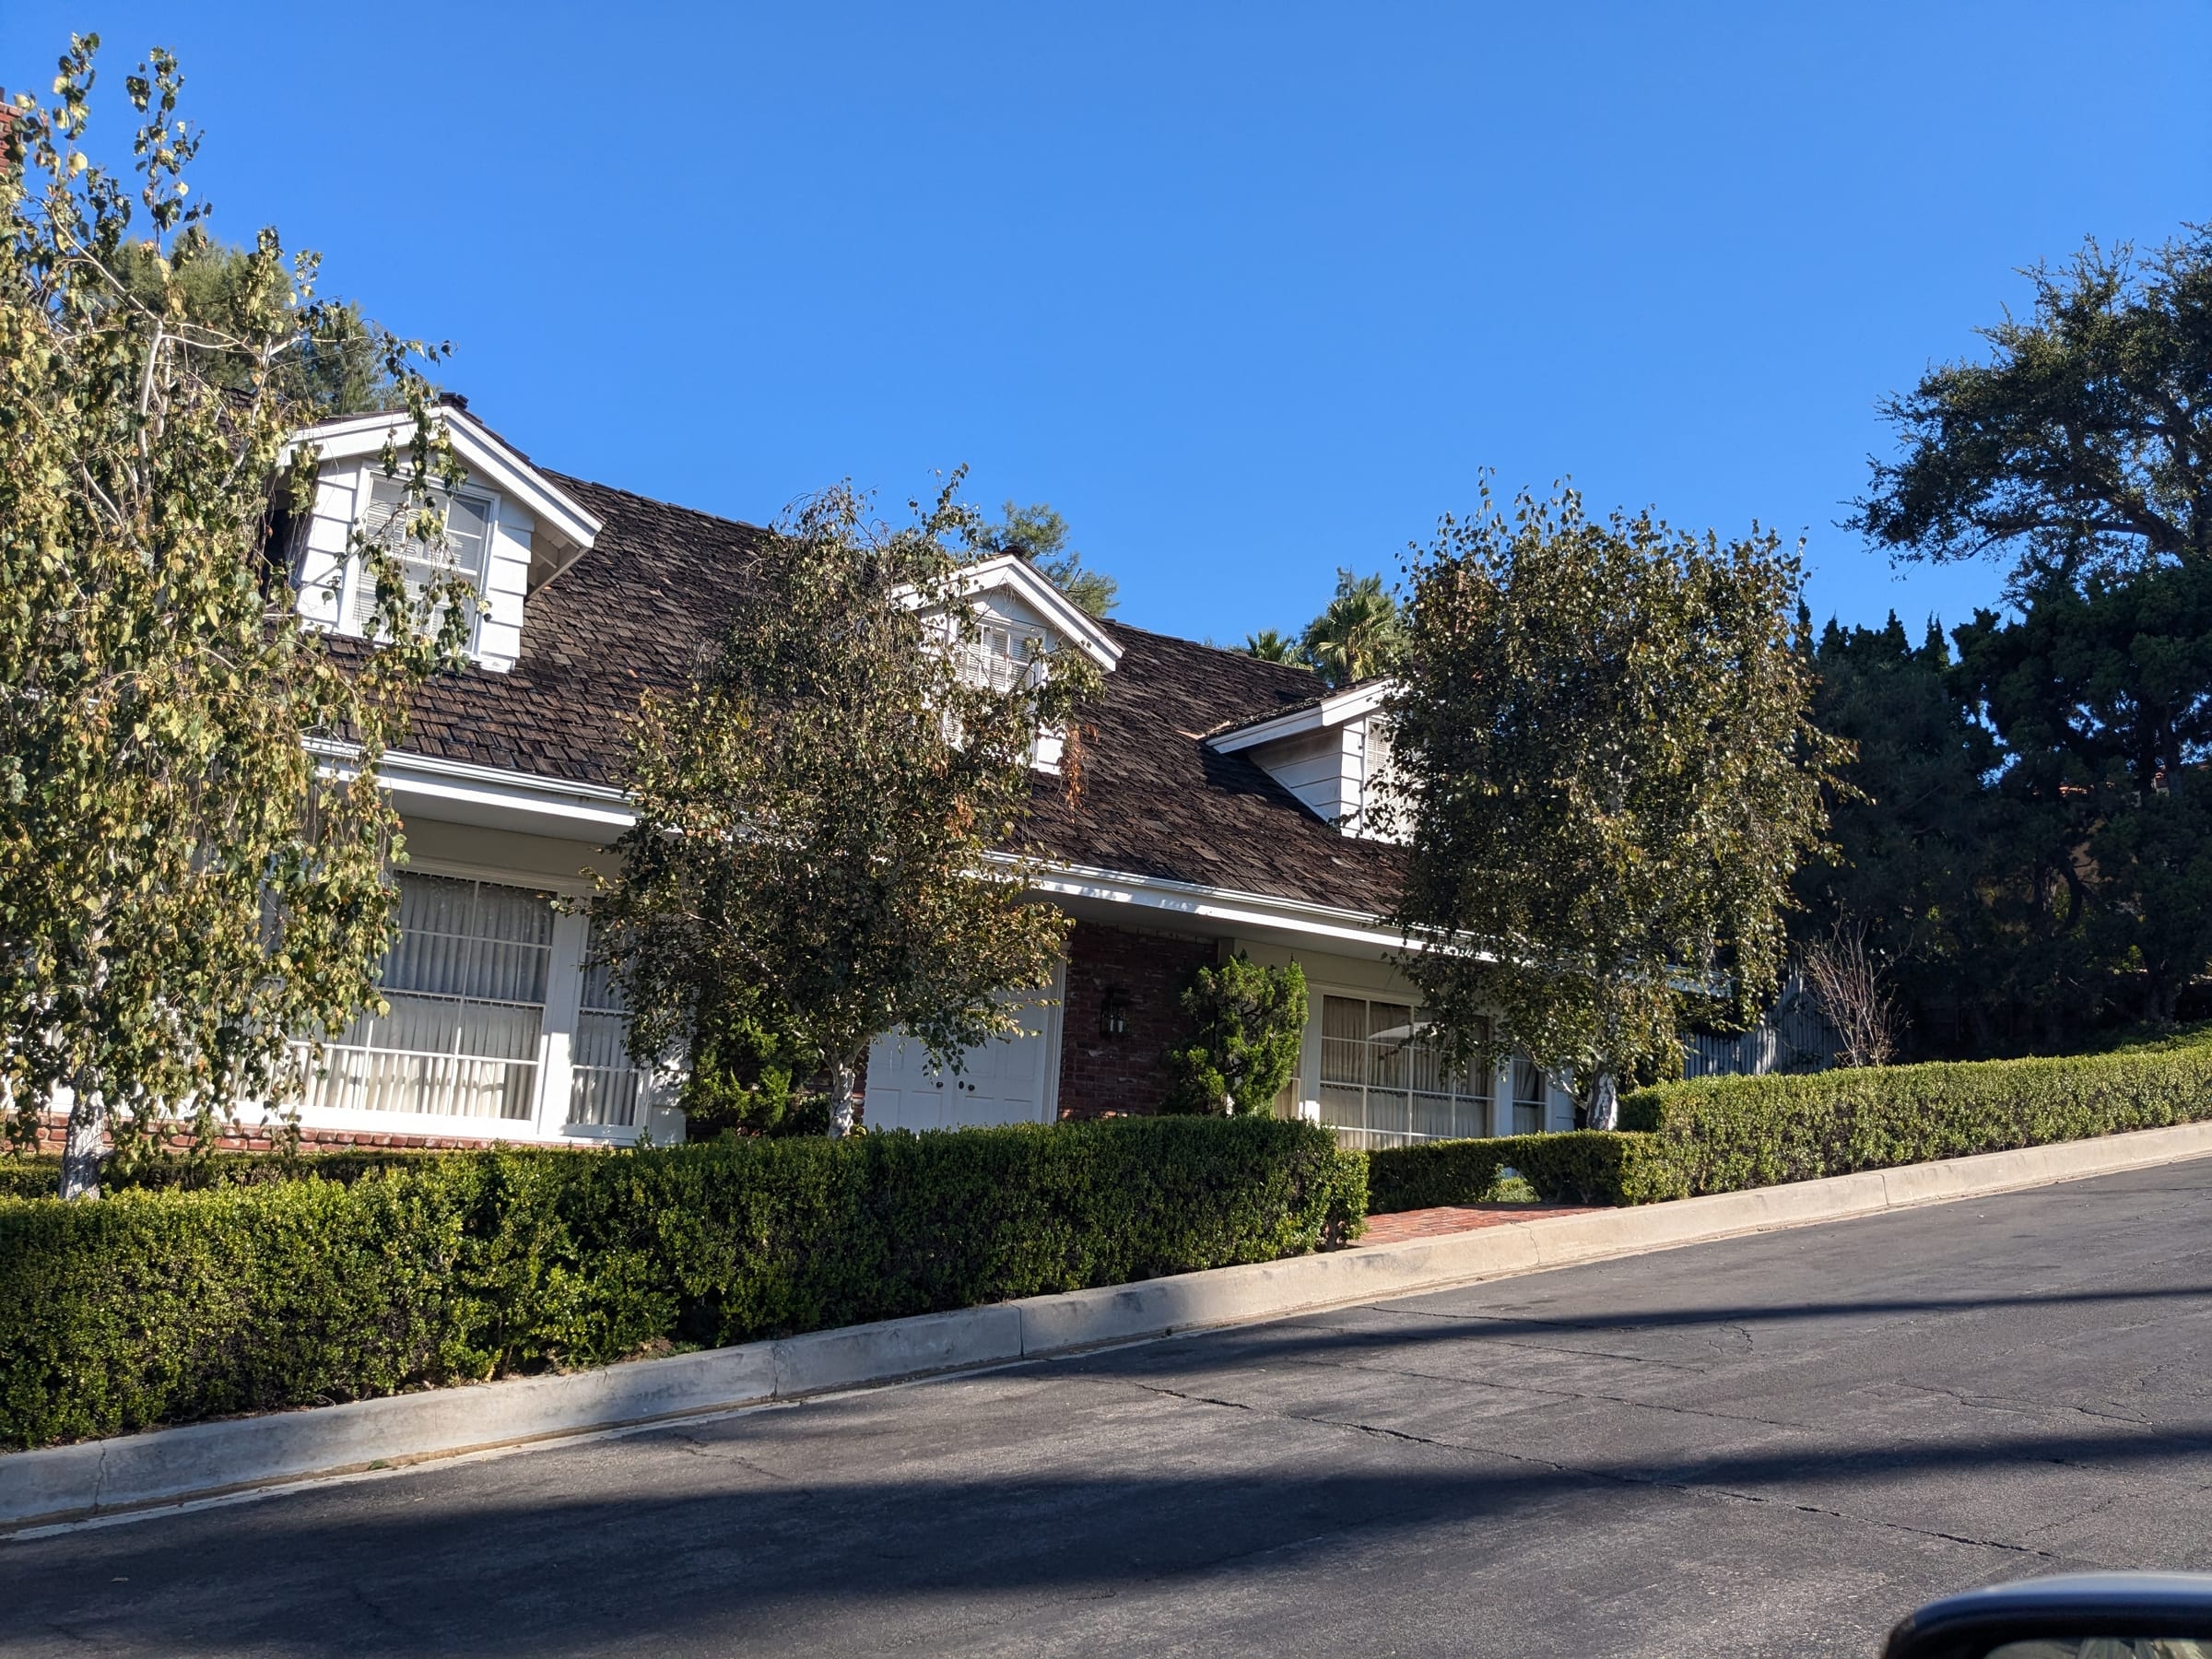
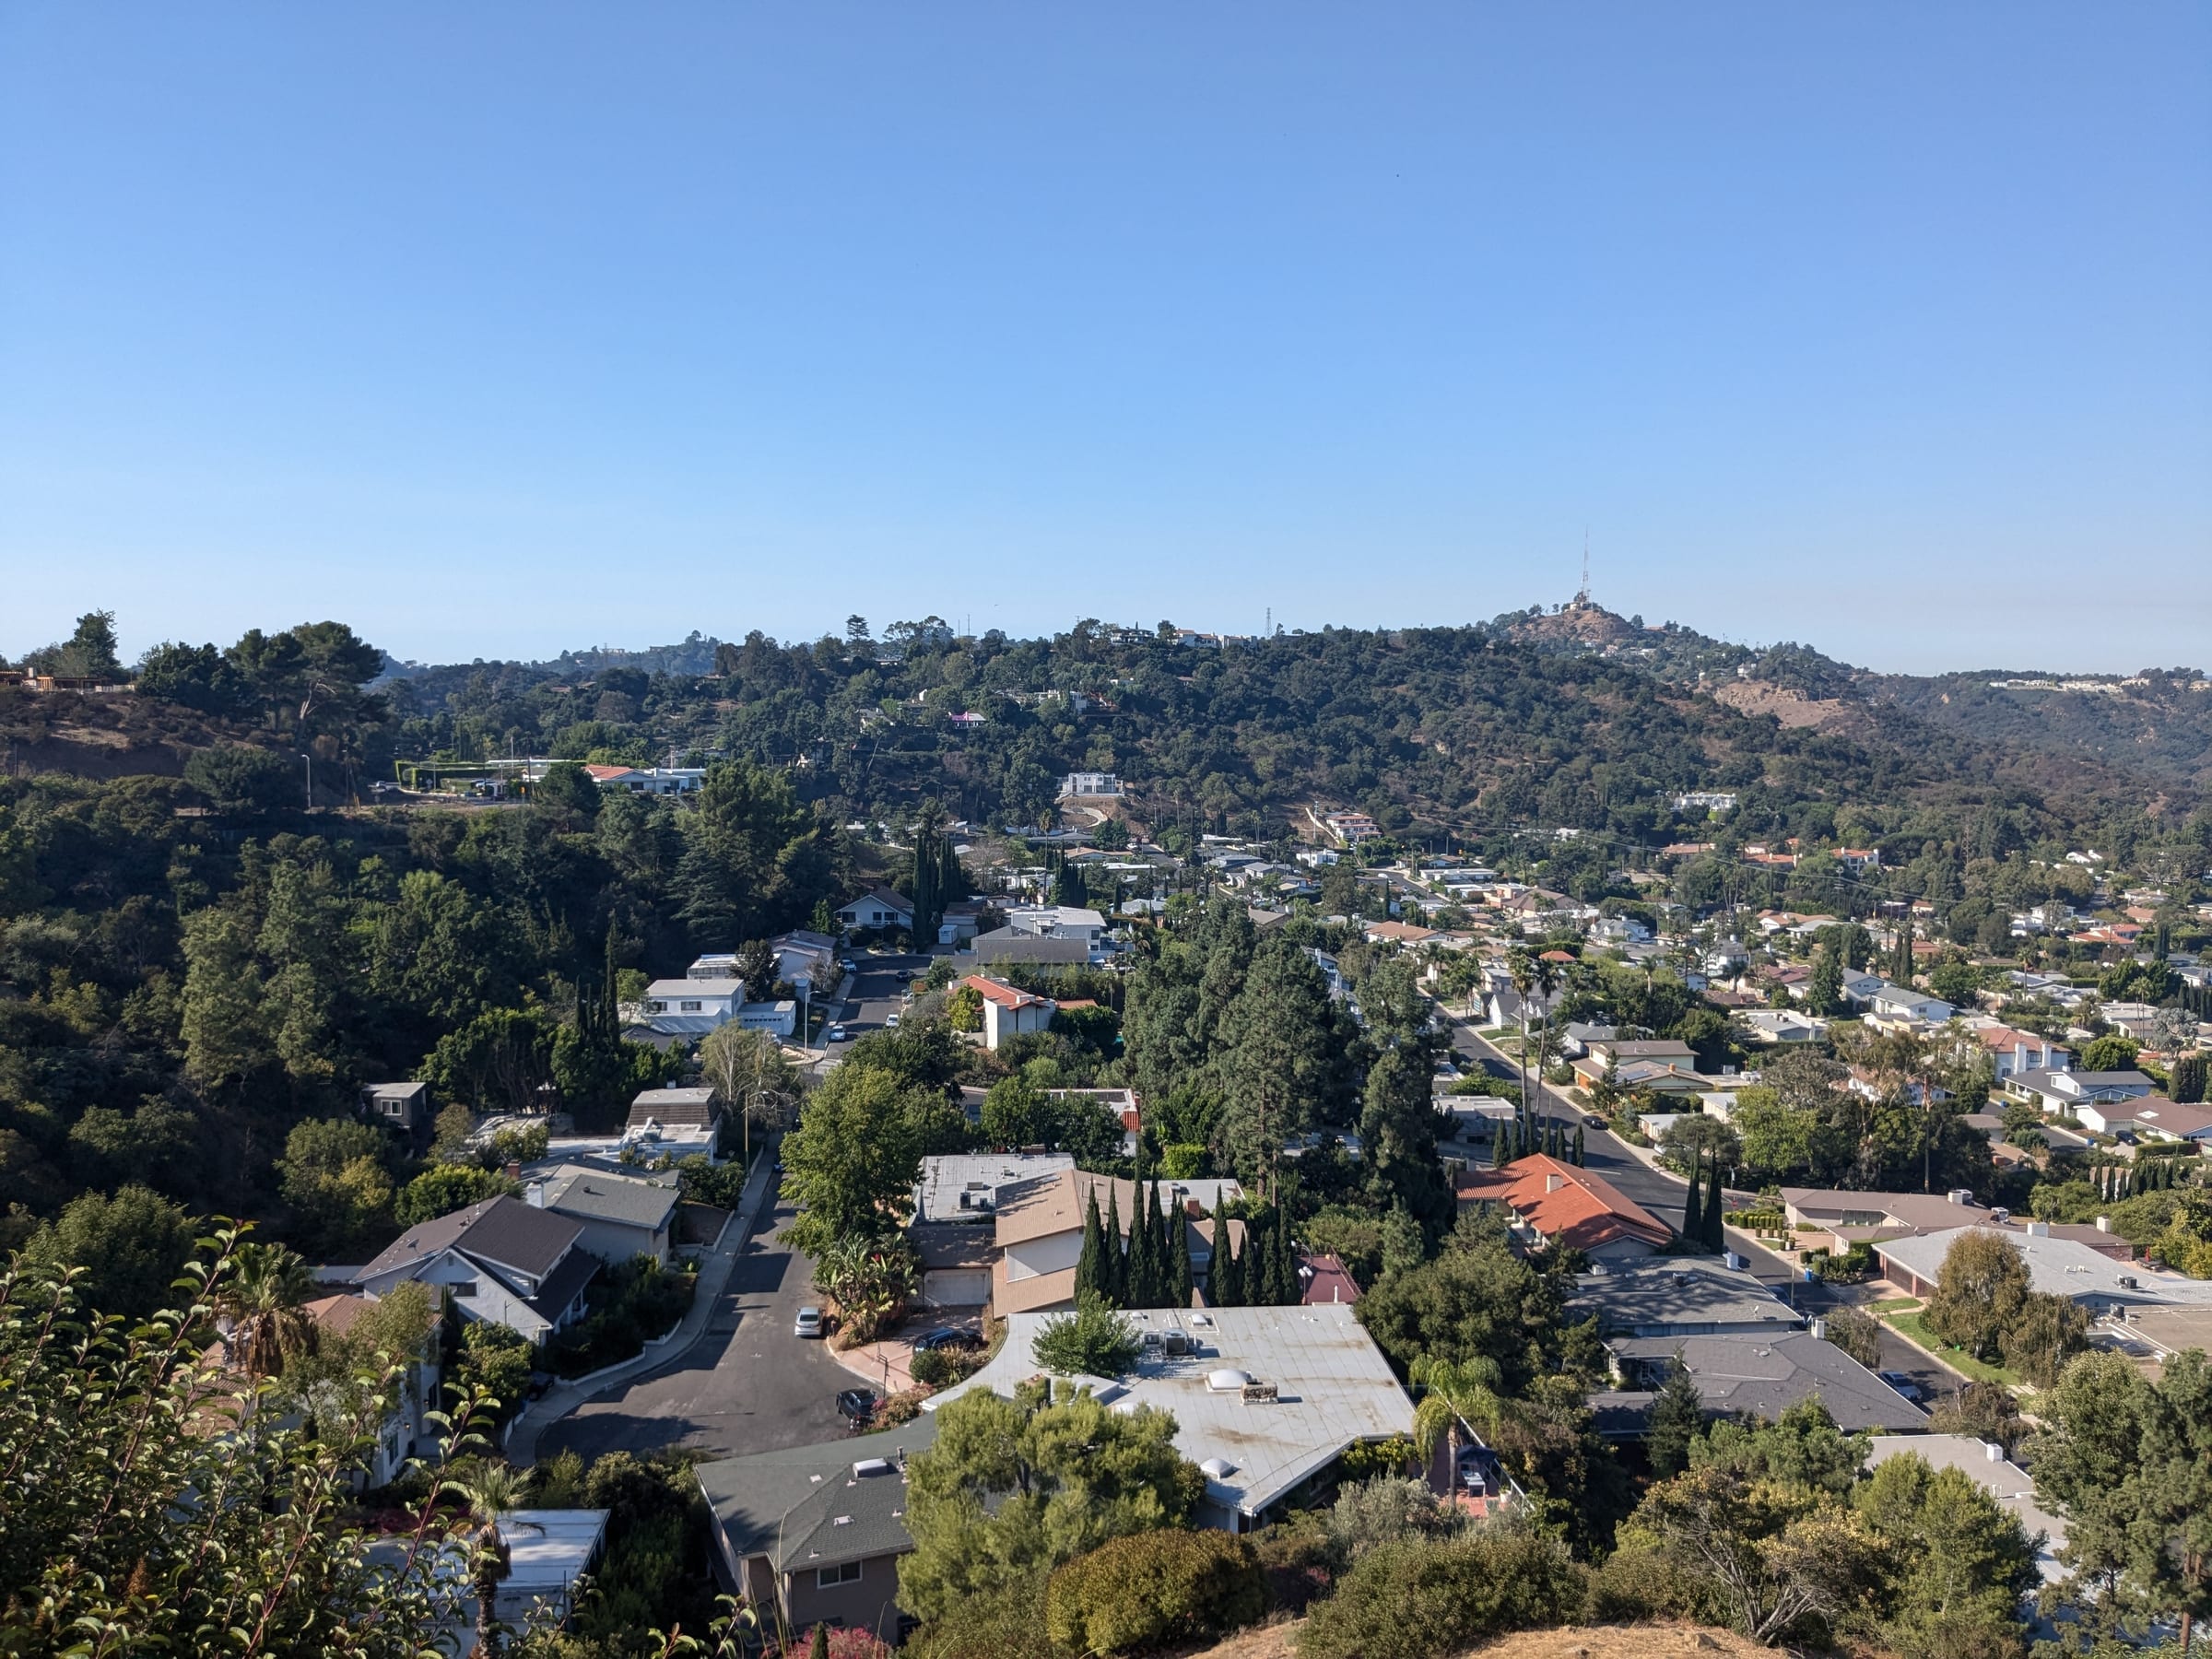
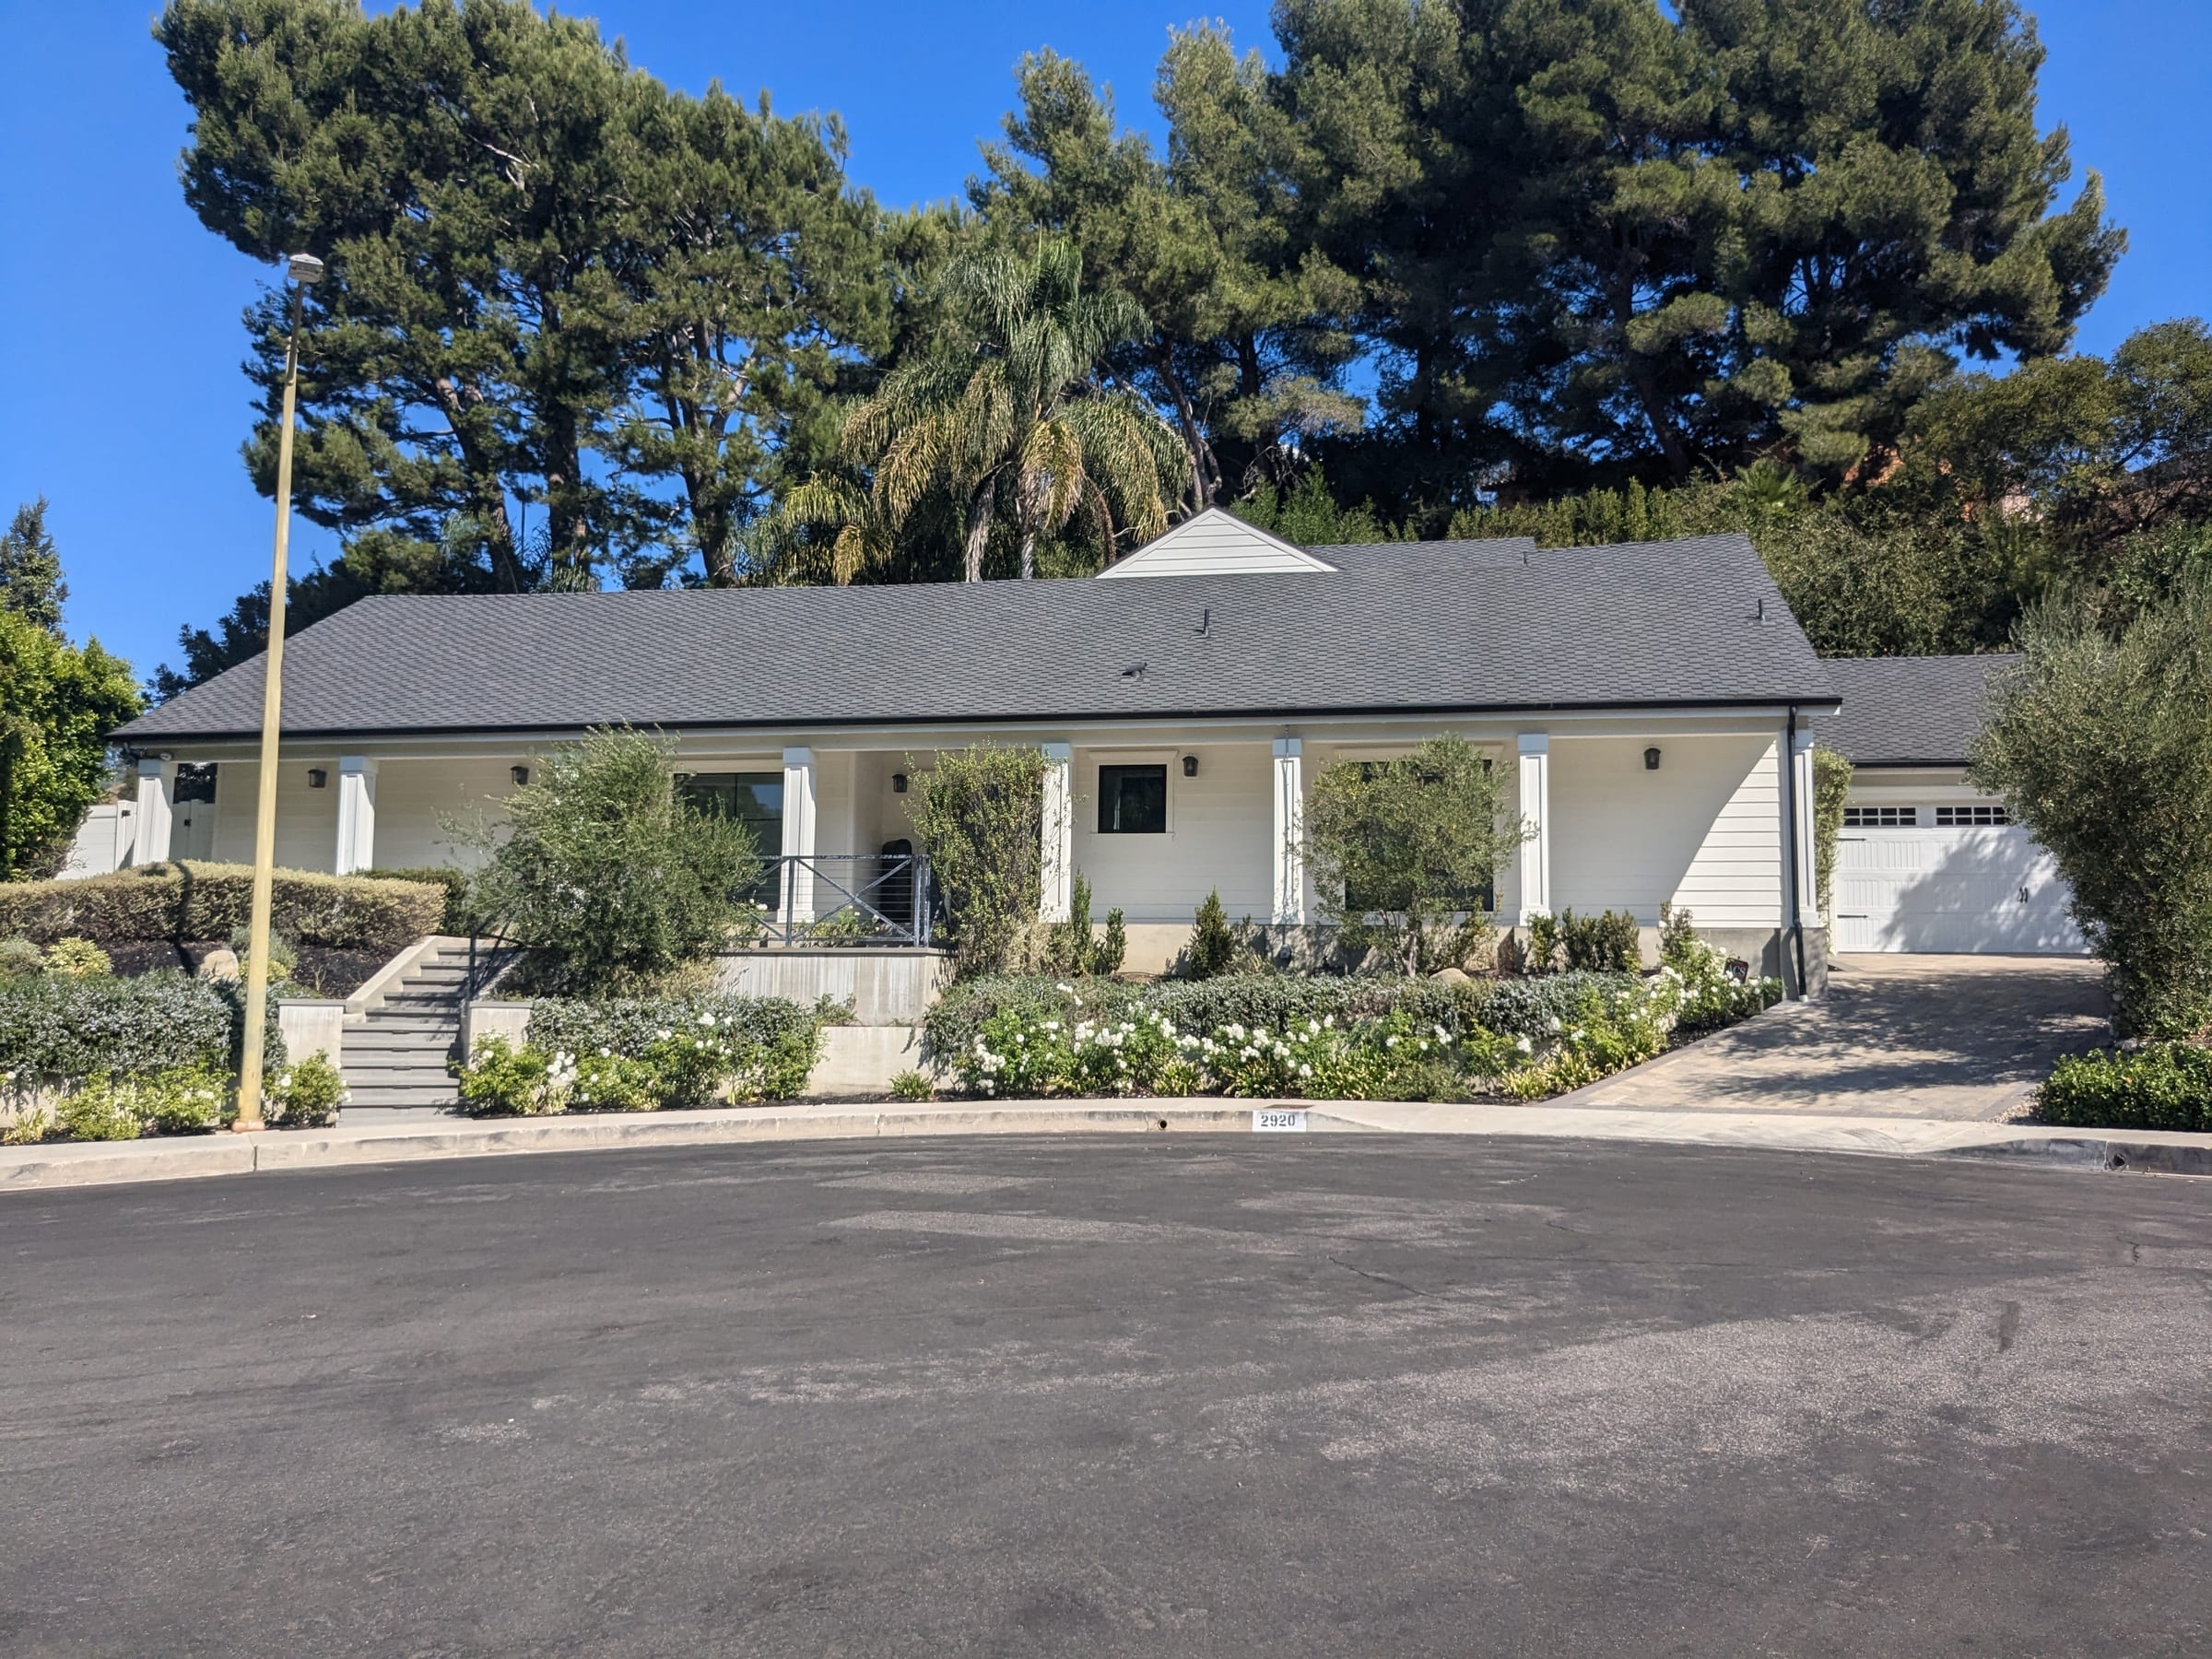
East Laurelwood
Misraje Real Estate Partners: Nine active listings in East Laurelwood are averaging 881 a foot, sitting just above the 12-month closed average of 845 a foot, while two homes under contract are pricing at 936 a foot, showing buyers are willing to transact above both the active pool and the trailing average when the product is right. The most recent closing, 11411 Doña Lola Drive at 567 a foot in early July, reflects a specific property condition rather than a market-wide repricing, as the under-contract homes are pricing 65% higher per foot. With 21 months of inventory based on the trailing 12-month absorption pace, this is a buyer-leaning market where pricing discipline and product quality separate homes that move from homes that sit.
| Metric | Q2 2026 | Q3 2026 | Change |
|---|---|---|---|
| Average Sale Price | $2,550,000 | $2,026,000 | Down 20.5% |
| Price per Sq Ft | $668 | $567 | Down 15.1% |
| Days on Market | 0 days | 85 days | Up 85 days |
| Highest Sale | $2,550,000 | $2,026,000 | Down 20.5% |
East Laurelwood
Average Sale Price by Quarter
East Laurelwood
Sold vs Active $/Sq Ft by Quarter
East Laurelwood
Jack Misraje: The one I keep coming back to is 3319 Doña Lola Place at 4.995 million, asking 1,151 a foot for a 4,340-square-foot home with view exposure and privacy, on the market just 14 days. That pricing sits 33% above the most similar recent comp, 3001 Doña Nenita Place at 900 a foot, but the view and siting justify the premium, and the short days on market suggest buyers see the value. At the other end, 3016 Doña Susana Drive at 3.6 million has been sitting 291 days at 534 a foot for a 6,745-square-foot home, and the resistance is the total dollar amount, not the per-foot number, buyers shopping at that level have a lot of options outside the Donas. Two homes priced in the 2.7 to 3 million range, 11268 Doña Lola Drive at 1,065 a foot and 2950 Doña Emilia Drive at 947 a foot, are both asking above the most similar recent comp at 900 a foot, and both have been on the market over 40 days, which isn't unusual at that price point but you do start watching closely after 30 days. The two under-contract homes are pricing at 913 a foot and 960 a foot, both in line with or slightly above recent comps, which tells me the active listings above 1,000 a foot need to justify the premium with product or they'll keep sitting.
Active · Aug 3, 2026
$1,999,000
4 bd · 3 ba · 2,796 sqft
1 DOM · $715/sqft · Built 1964 · Pool
Active · Jul 31, 2026
$2,995,000
5 bd · 4 ba · 3,772 sqft
4 DOM · $794/sqft · Built 1963 · Pool
Active · Jul 29, 2026
$4,995,000
4 bd · 5 ba · 4,340 sqft
14 DOM · $1,151/sqft · Built 1976 · Pool
Active · Jul 25, 2026
$1,875,000
3 bd · 3 ba · 2,440 sqft
18 DOM · $768/sqft · Built 1964
Active · Jul 1, 2026
$2,699,000
4 bd · 3 ba · 2,534 sqft
42 DOM · $1,065/sqft · Built 1965
Active · Jun 24, 2026
$2,749,000
4 bd · 3 ba · 2,903 sqft
67 DOM · $947/sqft · Built 1964 · Pool
Active · Jun 18, 2026
$2,985,000
4 bd · 3 ba · 3,159 sqft
57 DOM · $945/sqft · Built 1965 · Pool
Active · Jun 6, 2026
$3,195,000
4 bd · 4 ba · 3,157 sqft
67 DOM · $1,012/sqft · Built 1964 · Pool
Active · Mar 23, 2026
$3,600,000
5 bd · 6 ba · 6,745 sqft
291 DOM · $534/sqft · Built 1992
Get a custom opinion of value based on the most recent sales, current competition, and buyer demand in your section of Laurelwood.
Request a Home ValuationEast Laurelwood
Misraje Real Estate Partners: 3000 Doña Emilia Drive went under contract in three days at 2.4 million, asking 913 a foot for a 2,630-square-foot home with stronger finishes and indoor-outdoor flow, priced right at the most similar recent comp, 3001 Doña Nenita Place at 900 a foot. That immediate response confirms buyers are ready to move when pricing aligns with recent trades and the product is clean. 11428 Doña Lola Drive took 117 days to go under contract at 3.72 million, asking 960 a foot for a 3,873-square-foot remodeled home with view exposure and privacy, priced 21% below the most similar recent comp, 11351 Doña Lisa Drive at 1,218 a foot. The longer marketing time reflects the total dollar amount at 3.72 million, not the per-foot pricing, which is defensible for the product. Both under-contract homes are pricing near or above the 12-month closed average of 845 a foot, which means buyers and sellers are finding agreement at levels consistent with where the market has been closing over the past year, not at the lower end set by the most recent sale at 567 a foot.
Under Contract · Jul 29, 2026
$2,399,998
4 bd · 3 ba · 2,630 sqft
3 DOM · $913/sqft · Built 1964 · Pool
Under Contract · Jun 29, 2026
$3,720,000
6 bd · 7 ba · 3,873 sqft
117 DOM · $961/sqft · Built 1964 · Pool
Under Contract · May 22, 2026
$1,435,000
4 bd · 3 ba · 2,194 sqft
133 DOM · $745/sqft · Built 1965 · Pool
Stay ahead of the market with updates on new listings, escrow activity, and recent closings in East Laurelwood.
Get Market UpdatesEast Laurelwood
Karen Misraje: 11411 Doña Lola Drive closed in early July at 2.026 million after 85 days on the market, trading at 567 a foot for a 3,576-square-foot home with 12-foot vaulted ceilings. That per-foot number sits 33% below the 12-month average of 845 a foot, and the extended days on market signal the home needed work or carried deferred maintenance that buyers priced in. The two homes currently under contract at 913 a foot and 960 a foot are pricing 61% and 69% higher per foot than this July closing, which tells me the recent low trade reflects a specific property condition, not a market-wide repricing downward.
Sold · Jul 8, 2026
$2,026,000
4 bd · 4 ba · 3,576 sqft
85 DOM · $698/sqft · Built 1964
Sold · Apr 28, 2026
$2,550,000
4 bd · 3 ba · 3,816 sqft
0 DOM · $668/sqft · Built 1967
Sold · Mar 18, 2026
$4,700,000
5 bd · 6 ba · 3,859 sqft
13 DOM · $1,217/sqft · Built 1971 · Pool
Sold · Oct 28, 2025
$2,650,000
5 bd · 3 ba · 3,040 sqft
38 DOM · $872/sqft · Built 1964 · Pool
Sold · Oct 3, 2025
$2,724,000
4 bd · 4 ba · 3,026 sqft
66 DOM · $900/sqft · Built 1963 · Pool
East Laurelwood
Balance between supply and demand using active inventory, pending activity, recent closings, and exposure time.
Buyer Leaning
How quickly current inventory would sell at the pace of the last 12 months of closed sales. Lower months indicate stronger demand.
21.6 mo
Today's active and under-contract asking prices against where homes have actually closed. Whether asking levels sit above, near, or below the closed-sale range.
Above 1.2%
Misraje Real Estate Partners: Nine active listings and five closings over the trailing 12 months give us an absorption rate of approximately 21.6 months, which is a buyer-leaning market where supply exceeds near-term demand. Active listings are averaging 62 days on market, and two homes are under contract, which signals selective buyer activity rather than a stalled market. The average active asking price sits at 881 a foot, 4.3% above the 12-month closed average of 845 a foot, which means sellers are testing the market slightly above where homes have actually closed, and buyers are responding when the product justifies the ask. The two homes under contract are pricing at 936 a foot, 10.8% above the 12-month closed average, and that premium reflects product quality, updated or well-positioned homes are commanding more per foot than the broader market average. The most recent closing at 567 a foot sits well below both the active average and the under-contract pricing, which tells me that trade was an outlier tied to property condition, not a signal that the market is repricing downward. Buyers are engaging at or above the 12-month average when the product is right, and the homes sitting longest are either priced above their operative comps or carrying total dollar amounts that limit the buyer pool.